News Updates
NEWS CENTER
Related News
There is currently no data available
Global intellectual property quantity and distribution in 2021!
Release Time:
2022-06-07
In 2020, global patent applications rebounded with a growth rate of 1.6%, while trademark and industrial design application activities increased by 13.7% and 2% respectively.
Introduction: Intellectual property, as a very large industry, is highly valued both domestically and internationally. With the continuous development of China's intellectual property industry, the innovation and business environment have been further improved, which has also given China a place in the intellectual property industry!
At the same time, we also hope that through objective data analysis, it not only affirms the Chinese intellectual property industry and has a promising future, but also contains opportunities for the development of our country's intellectual property industry! Catch up with other countries!
Global intellectual property quantity and distribution in 2021
1、 Overall situation
In 2020, global patent applications rebounded with a growth rate of 1.6%, while trademark and industrial design application activities increased by 13.7% and 2% respectively. In terms of quantity, the global patent application volume is 300000, trademark application volume reaches 17.2 million, and industrial design application volume reaches 1.4 million. The number of applications for utility models (a special form of patent) increased by 28.1%, reaching 3 million.
2019-2020年全球知识产权申请总量(单位:万件)
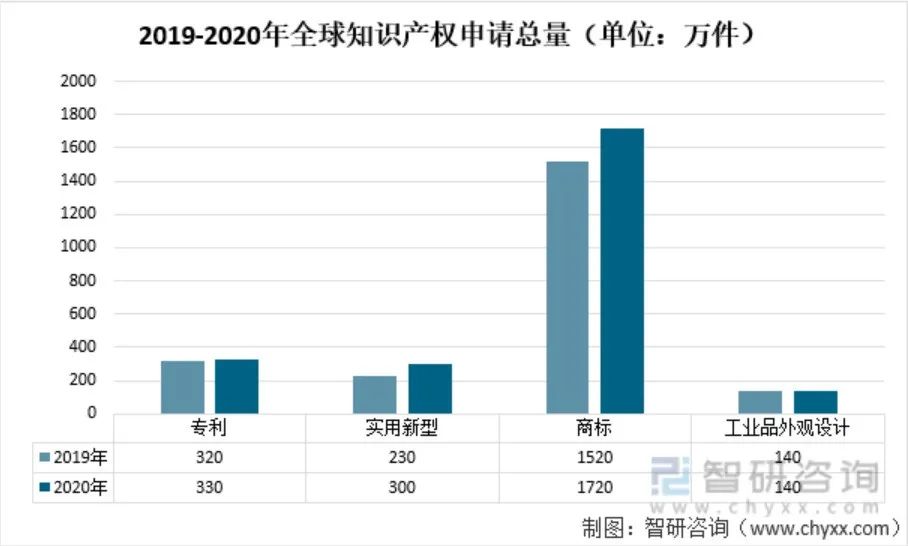
Source: Intellectual Property Statistics Data Center, World Intellectual Property Organization, and Intelligence Research Consulting
From the proportion of intellectual property applications in various regions, Asian authorities account for about two-thirds or even more of the global patent, trademark, and industrial design application activities, and almost all of the global utility model application activities.
The proportion of intellectual property applications by region in 2020

Source: Intellectual Property Statistics Data Center, World Intellectual Property Organization, and Intelligence Research Consulting
Related report: "2022-2028 China Intellectual Property Industry Panoramic Survey and Competitive Pattern Prediction Report" released by Zhiyan Consulting
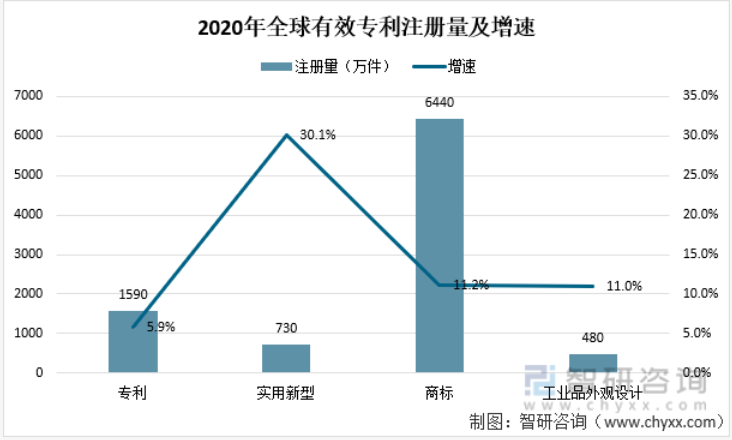
In 2020, the number of valid patents worldwide increased by 5.9%, reaching approximately 15.9 million. The United States has the highest number of valid patents, with approximately 3.3 million, China has 3.1 million, and Japan has 2 million. In 2020, there were approximately 64.4 million valid trademarks worldwide, an increase of 11.2% compared to 2019. Among them, China alone has 30.2 million pieces, the United States has 2.6 million pieces, and India has 2.4 million pieces. In 2020, the number of effective industrial design registrations worldwide increased by 11.0%, reaching approximately 4.8 million pieces. The country with the highest number of valid registrations is China, with approximately 2.2 million, the United States with 371900, and South Korea with 369500.
Global effective patent registration volume and growth rate in 2020

Data source: Intellectual Property Statistics Data Center, Intelligence Research Consulting Compilation
2、 Patent situation
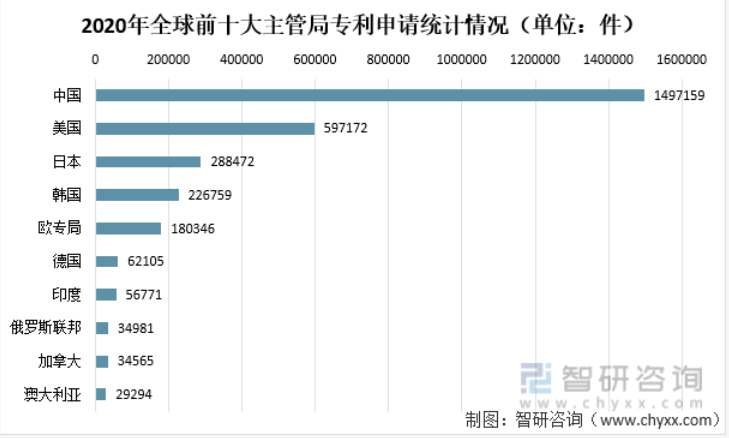
In 2020, the total number of global patent applications was 3276700, including 1497159 in China, 597172 in the United States, 288472 in Japan, 226759 in South Korea, 180346 in the European Patent Office, 62105 in Germany, 56771 in India, 34981 in the Russian Federation, and 34656 in Canada, There are 29294 patent applications in Australia.
Statistics of patent applications from the top ten global regulatory agencies in 2020 (unit: pieces)
Data source: Intellectual Property Statistics Data Center, Intelligence Research Consulting Compilation
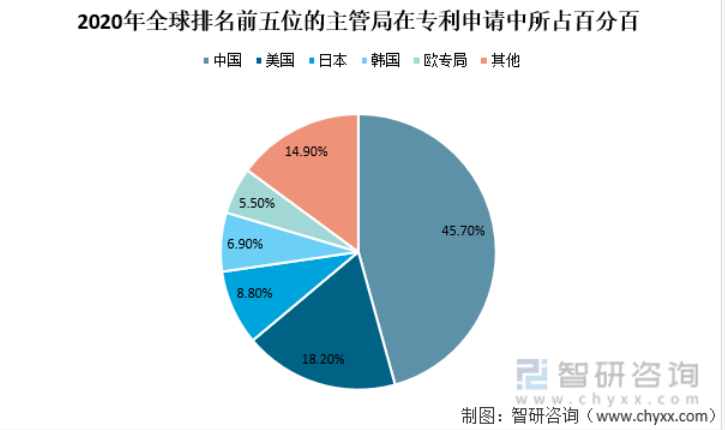
In terms of proportion, China's patent application volume accounts for 45.7% of the global total, ranking first. The United States accounts for 18.2% of the global total patent applications, ranking second; Japanese patent applications account for 8.8% of the global total, ranking third. The top five regulatory agencies accounted for 85.1% of the total global patent applications in 2020, an increase of 7.7 percentage points compared to the total proportion of the top five agencies in 2010.
The percentage of top five global regulatory agencies in patent applications in 2020
Data source: Intellectual Property Statistics Data Center, Intelligence Research Consulting Compilation
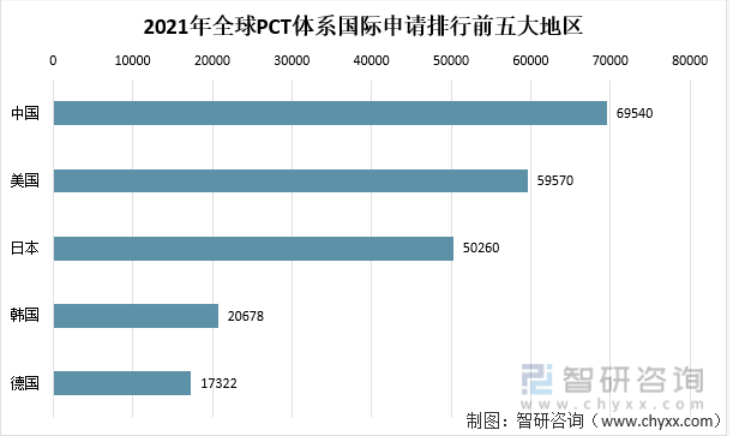
In 2021, applicants residing in China, as the largest user of the property rights organization's PCT system, expanded their leading advantage by applying for 69540 applications, an increase of 0.9% compared to 2020. Next was the United States, with 59570 applications, a year-on-year increase of 1.9%; Japan applied for 50260 applications, a year-on-year decrease of 0.6%; South Korea applied for 20678 applications, a year-on-year increase of 3.2%; Germany applied for 17322 cases, a year-on-year decrease of 6.4%.
The top five regions in the 2021 global PCT system international application rankings
Data source: Intellectual Property Statistics Data Center, Intelligence Research Consulting Compilation
Chinese telecommunications giant Huawei Technologies Co., Ltd. (6952 cases) became the largest PCT applicant in 2021. Following closely behind are Qualcomm in the United States (3931 pieces), Samsung Electronics in South Korea (3041 pieces), LG Electronics in South Korea (2885 pieces), and Mitsubishi Electric Co., Ltd. in Japan (2673 pieces). Among the top 10 applicants, Qualcomm announced the fastest growth in application numbers in 2021 (+80.9%), jumping from 5th place in 2020 to 2nd place in 2021. Qualcomm's application volume related to digital communication has almost doubled.
Top 5 PCT applicants globally in 2021
Data source: Intellectual Property Statistics Data Center, Intelligence Research Consulting Compilation
The proportion of PCT applications for computer technology is the highest (9.9%), followed by digital communication (9%), medical technology (7.1%), electrical and mechanical (6.9%), and measurement (4.6%). In 2021, six of the top 10 technology fields saw growth, with pharmaceuticals (+12.8%) growing the fastest, followed by biotechnology (+9.5%), computer technology (7.2%), and digital communication (+6.9%). As the pandemic spreads, the growth in these areas demonstrates the vitality of health-related technologies and the sustained opportunities for digital technological progress.
Distribution proportion of global PCT technology patents in 2021
Data source: Intellectual Property Statistics Data Center, Intelligence Research Consulting Compilation
3、 Trademark
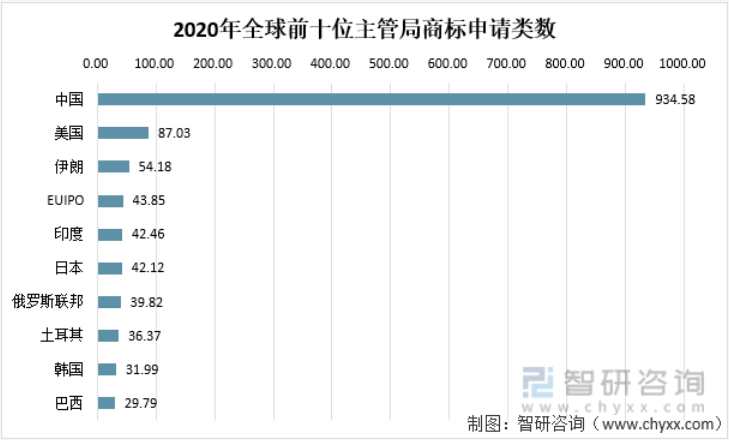
From the distribution of trademark applications, the number of application categories by the Chinese regulatory authorities reached 9.3458 million, followed by the US regulatory authorities with 870300 application categories. After the top two major categories, Iran's regulatory agency has 541800 application categories, and the European Union Intellectual Property Office has 438500 application categories (424583 categories). The agency has surpassed Japan since 2020 and ranks fifth
Number of trademark application categories for the top ten global regulatory offices in 2020
Data source: Intellectual Property Statistics Data Center, Intelligence Research Consulting Compilation
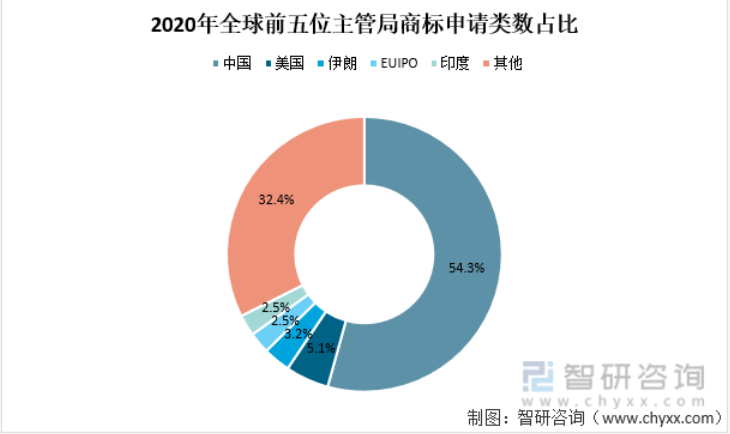
In 2020, the top five regulatory agencies accounted for approximately 68% of global trademark application activity (calculated by category). The competent authorities in China account for 54.3% of the total global trademark application activities, and the applications mainly come from Chinese residents. The remaining four regulatory agencies in the top five each account for 5% or less of the total.
The proportion of trademark application categories in the top five global regulatory offices in 2020
Data source: Intellectual Property Statistics Data Center, Intelligence Research Consulting Compilation
4、 Industrial appearance design
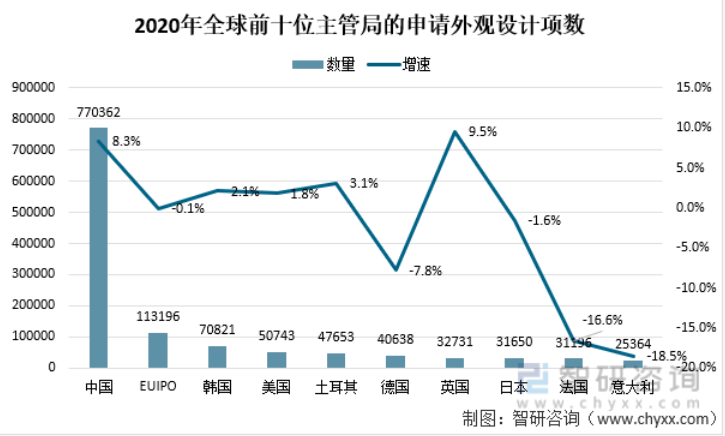
In 2020, the number of industrial design applications submitted globally was approximately 1.1 million. These applications include 1.4 million exterior designs, with a growth rate of 2%. In 2020, among the top ten regulatory agencies, both the UK (+9.5%) and China (+8.3%) achieved strong annual growth in the number of design applications received, while Italy (-18.59%) and France (-16.6%) both experienced significant year-on-year declines.
Number of exterior design applications from the top ten global regulatory agencies in 2020
Data source: Intellectual Property Statistics Data Center, Intelligence Research Consulting Compilation
The above data and information can be referred to the "2022-2028 China Intellectual Property Industry Competition Strategy Research and Future Outlook Report" released by Zhiyan Consulting.
More intellectual property information and services
Pay attention to [Shenkexin Intellectual Property] Official subscription number

More deeply credible dynamic news, important data/report/case, etc.
Pay attention to the [Shenkexin Intellectual Property Service Platform] official service number

相关新闻
Telephone:
Telephone:+86-755-82566227、82566717、13751089600
Head Office:13 / F, Building 14, Longhua Science and Technology Innovation Center (Mission Hills), No. 8 Golf Avenue, Guanlan Street, Longhua District, Shenzhen
Head Office:
13 / F, Building 14, Longhua Science and Technology Innovation Center (Mission Hills), No. 8 Golf Avenue, Guanlan Street, Longhua District, Shenzhen
Subsidiary Company:2808, Block B2, Yuexiu Xinghui Junbo, No.18 Tazihu East Road, Jiangan District, Wuhan City, Hubei Province
Subsidiary Company:
2808, Block B2, Yuexiu Xinghui Junbo, No.18 Tazihu East Road, Jiangan District, Wuhan City, Hubei Province

Service Number

Subscription Number
Copyright ©2016 Shenzhen Shenkexin patent Agency Co., LTD All rights reserved | 粤ICP备2021174526号
Copyright ©2016 深圳市深可信专利代理有限公司 版权所有 | 粤ICP备2021174526号 SEO标签
Copyright ©2016 深圳市深可信专利代理有限公司 版权所有